
Delta Trading Pressure Indicator
The Delta Trading Pressure Indicator measures net aggressive market buy volume versus sell volume per candle, exposing whether buyers or sellers dominated transactions regardless of whether the candlestick closed green or red.
Available in the Pro tier. Includes native crypto chart tools and TradingView invite scripts for equities/forex.
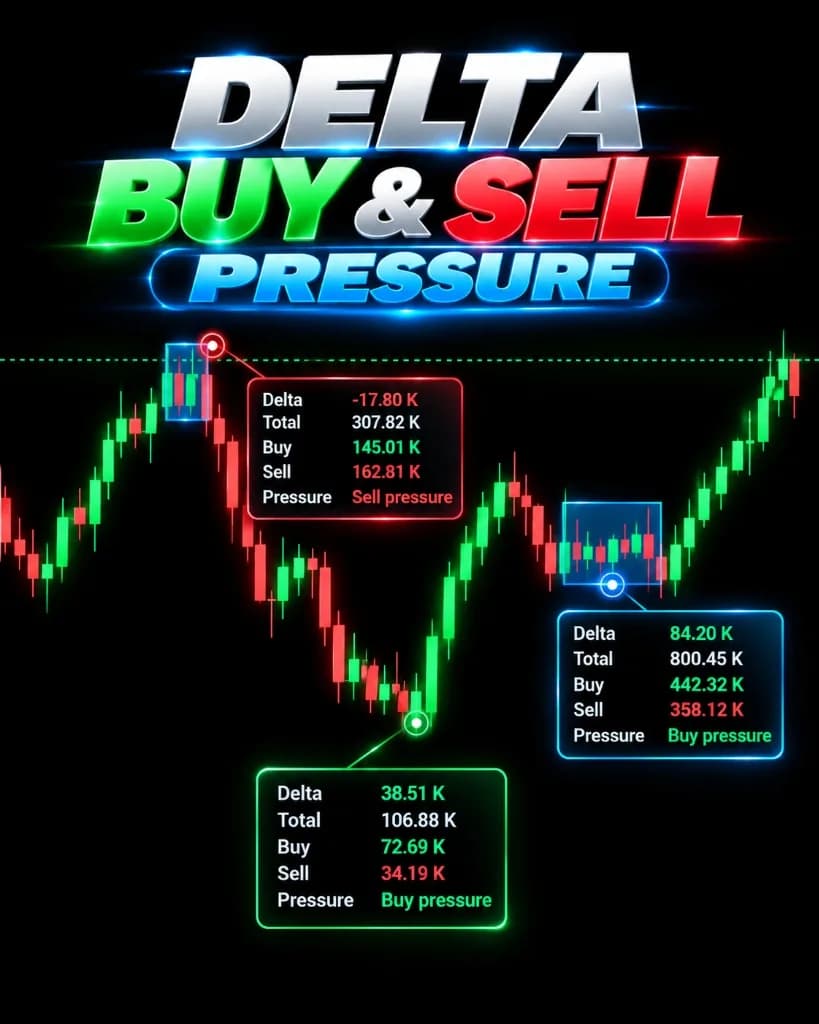
How it is calculated
Calculates the net difference between market buy volume and market sell volume across each candle bar, comparing the resulting delta with rolling historical averages to detect absorption divergence.
Calculation Inputs & Parameters
- Lookback smoothing period (Default: 14 bars)
- Absorption divergence threshold
- Volume baseline source
Signal Trigger Conditions
- Bullish Absorption: Price makes a new swing low while delta prints a higher low or positive net reading.
- Bearish Absorption: Price makes a new swing high while delta prints a lower high or negative net reading.
How to read it
Understanding the visual elements rendered on the chart:
Positive net delta; aggressive market orders were dominated by buyers.
Negative net delta; aggressive market orders were dominated by sellers.
Divergence warning where aggressive delta opposes price direction, signaling resting limit orders are absorbing the move.
Limitations and edge cases
Delta data relies directly on exchange tick quality. On aggregated feeds or CFDs without genuine volume, delta estimates lose precision.
Unsuited Market Conditions
- Brokers with synthetic tick volume rather than centralized exchange order book feeds.
- Extremely low volatility ranges where delta oscillation is negligible.
What this indicator does not do
- Does not indicate the specific price level of resting limit orders.
- Does not guarantee price direction in the presence of iceberg market execution.