
PRECISION
OVER SPECULATION.
A structured education in technical analysis — from candlestick anatomy and Smart Money Concepts to proprietary Nadaraya-Watson envelope strategies and AI-assisted real-time chart interpretation.
Technical infrastructure for the
modern market analyst
Price Action & Smart Money Concepts
Dissect market structure through BOS, CHoCH, demand/supply zones, and liquidity sweeps — visualized as architectural precision diagrams.
Proprietary Nadaraya-Watson Suite
Master the kernel regression envelope, Gaussian smoothing bands, and multi-timeframe signal confluence — the mathematical core of institutional edge.
Real-Time AI Chart Interpretation
The AI assistant reads RSI, Stochastic, NWE, and Bollinger Band context simultaneously, delivering structured natural-language analysis without cognitive overload.
Candlestick Anatomy
From doji to engulfing — understand what each formation communicates about supply/demand pressure.
Multi-Timeframe Confluence
Align 1m, 15m, 1h, and daily context to identify only the highest-probability entry regions.
Live Chart Sessions
Real-time co-analysis with instructors — watch every decision narrated as it forms in the market.
Scalping & Swing Plans
Complete trade plan frameworks: entry triggers, invalidation levels, target ratios, and position sizing models.
Bar Replay Practice Engine
Replay historical sessions bar-by-bar on our live chart platform to develop decision-making under simulated pressure.
Position Sizing & Risk Math
Kelly criterion, fixed-fractional sizing, and drawdown management — the mathematics of capital preservation.
Structured analysis.
Without the noise.
Our AI assistant processes RSI, Stochastic, Nadaraya-Watson envelope, and Bollinger Band state simultaneously — then delivers structured educational context in plain language, without overwhelming you with conflicting signals.
Price is forming a new higher high, but RSI(14) is recording a lower high at 58.4 vs prior 71.2. This is a classic bearish hidden divergence.
Interpreted in context: momentum is contracting despite price extension — a pattern that historically precedes reduced continuation probability.
From price action basics
to institutional order flow
Price Action Fundamentals
Candlestick anatomy, OHLC relationships, and what price is communicating before any indicator is applied.
Indicator Mathematics
RSI, Stochastic RSI, MACD, and Bollinger Bands — from formula derivation to real-world signal interpretation.
Nadaraya-Watson Envelope
Proprietary kernel regression analysis: Gaussian smoothing, bandwidth tuning, and envelope cross signals.
Smart Money Concepts
Break of Structure, Change of Character, order block validation, liquidity sweep detection.
Multi-Timeframe Confluence
Aligning 1m through 1D timeframes to identify genuinely high-probability setup regions.
Trade Plan & Risk Architecture
Entry mechanics, invalidation logic, position sizing models, and psychological process documentation.
Choose your access tier
One-time or monthly access to structured courses, live sessions, and our interactive charting platform.
Pro
- Get indicator invites on trading view, for other charting than crypto
- Real-time buy/sell signals
- Advanced technical indicators
- AI chart analysis (100/mo)
- Unlimited Watchlist
- Standard support
Ultra Pro
- Access all tools and indicator
- Everything in Pro
- Masterclass Video Series
- Smart Money Concepts (SMC)
- Unlimited AI chart analysis
- Priority 24/7 support
- 1-on-1 onboarding
What analysts are saying
"The AI Trading Guide is like having a second pair of expert eyes on my charts. It completely changed how I find confluence."
"I need speed, and this platform delivers. The live tick data combined with the custom Stochastic RSI is my holy grail setup."
"Finally, a premium charting app that doesn't look like it was built in 1995. The dark mode is beautiful and the indicators are incredibly precise."
Sample lessons
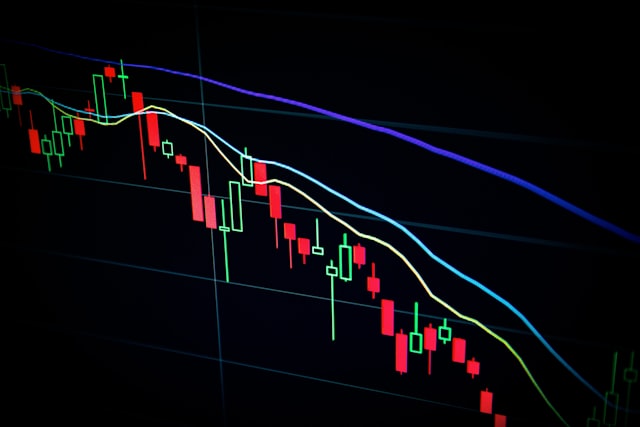
Getting Started with the Platform
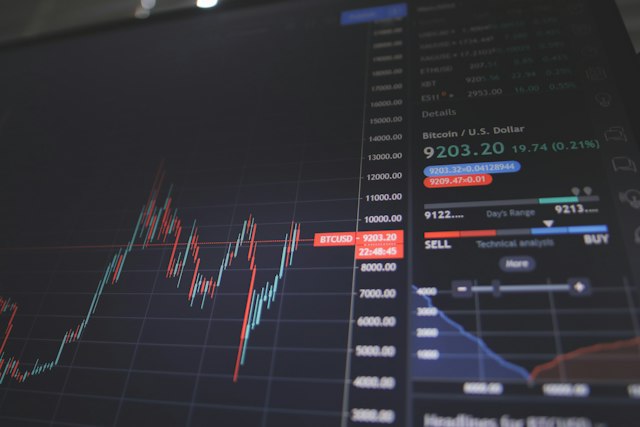
Reading the Buy/Sell Gauges

Scalping Setup Guide

Using the AI Trading Guide
READY TO TRADE WITH
REAL KNOWLEDGE?
Join analysts learning to read markets with institutional precision — through structured theory, live sessions, and interactive charting practice.