
PullBack Entry Indicator
The PullBack Entry Indicator identifies trend continuation opportunities by plotting dynamic support levels and directional entry markers on completed candlestick closes during established market trends.
Available in the Pro tier. Includes native crypto chart tools and TradingView invite scripts for equities/forex.
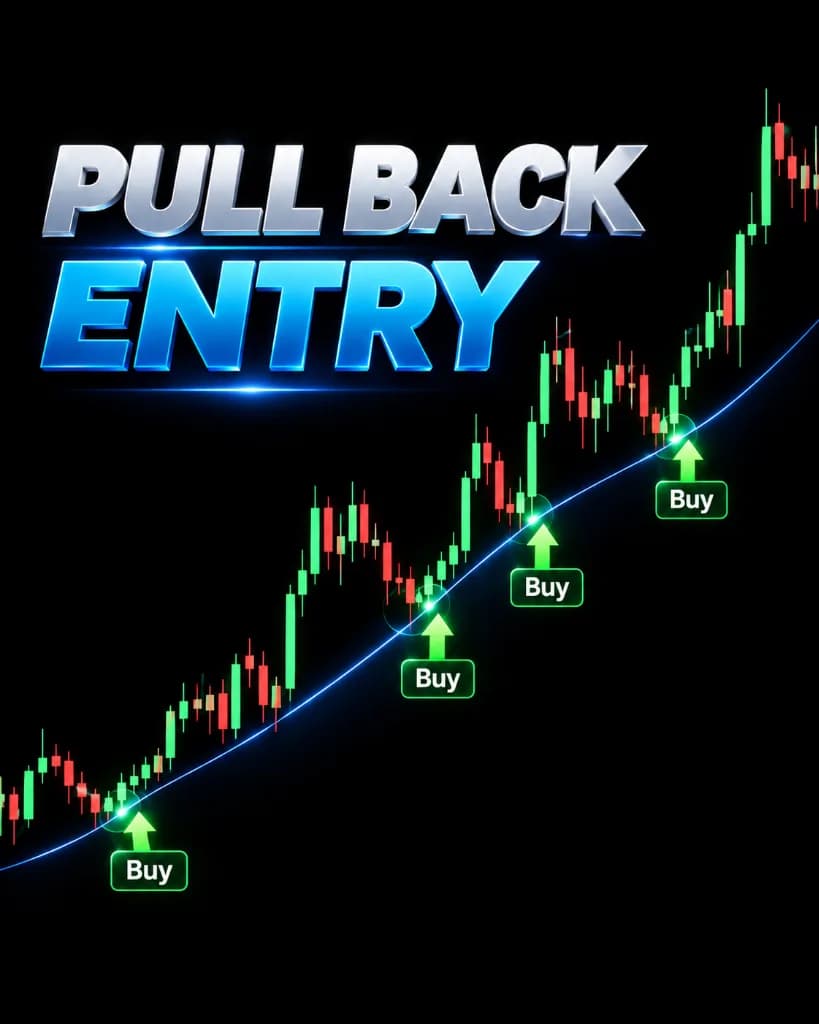
How it is calculated
Calculates multi-period exponential moving average slope alignment across higher and local timeframes, registering a signal only when price tests the moving boundary and closes in the primary trend direction.
Calculation Inputs & Parameters
- Fast EMA (Default: 20 period)
- Slow EMA (Default: 50 period)
- Trend Filter EMA (Default: 200 period)
- Structural swing lookback (Default: 10 bars)
Signal Trigger Conditions
- Higher timeframe trend filter EMA must be ascending for longs or descending for shorts.
- Price must retrace into the dynamic 20–50 EMA band without closing past the swing invalidation.
- Candle must close with rejection wick away from the dynamic band in the trend direction.
How to read it
Understanding the visual elements rendered on the chart:
Represents the equilibrium pullback zone. When bands are green and expanding, bullish momentum is active; red and expanding indicates bearish momentum.
Prints on candle close when a pullback into the ribbon completes with directional candle confirmation. Invalidation is established at the recent swing pivot.
Trailing stop boundary derived from rolling swing extremes to protect open positions as price advances.
Limitations and edge cases
This indicator is engineered strictly for trending markets. It produces repeated false signals in consolidating, choppy, or range-bound conditions.
Unsuited Market Conditions
- Sideways chop where the 200 EMA is completely horizontal and price repeatedly crosses it.
- Low-liquidity weekend sessions or market opens before volatility expands.
- Major macroeconomic news releases (CPI, FOMC, NFP) where slippage invalidates moving averages.
What this indicator does not do
- Does not predict tops or bottoms; it only trades in the direction of existing slope.
- Does not calculate position size or margin requirements.
- Does not guarantee bounce continuation after a dynamic band touch.