
Standard VWAP Reversal Indicator
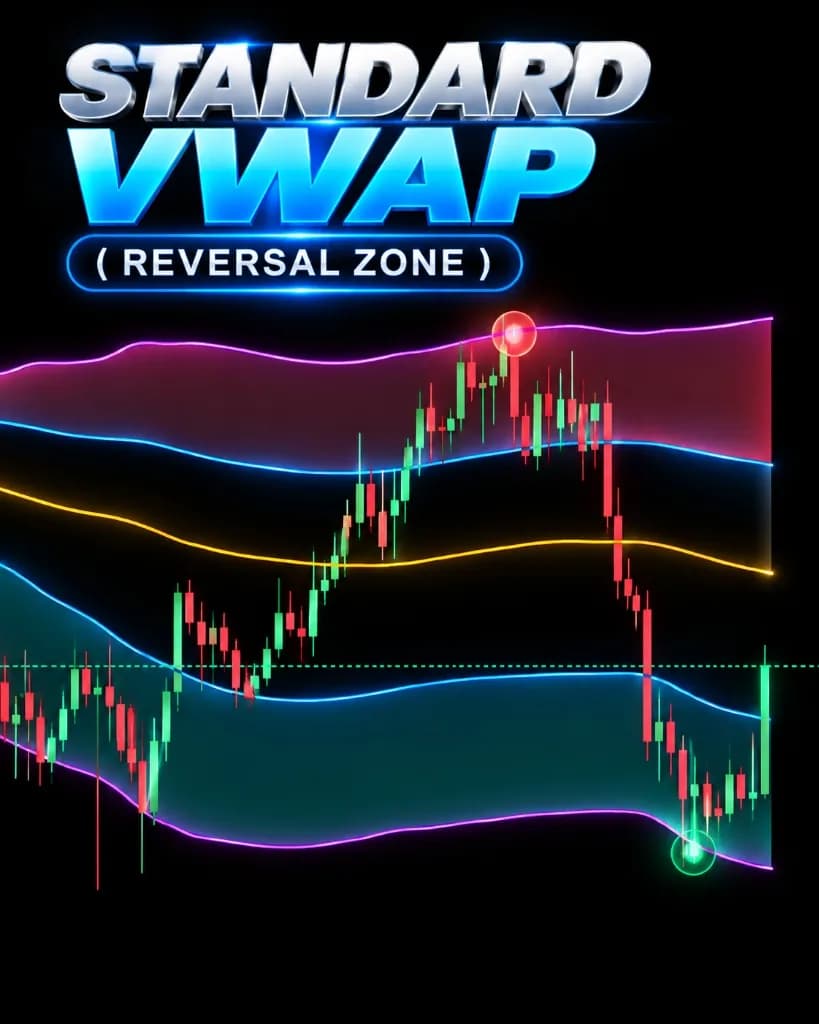
The Standard VWAP Reversal Indicator plots volume-weighted benchmark average price alongside multi-sigma statistical deviation bands to identify extreme overextension and mean-reversion snapback zones.
Available in the Pro tier. Includes native crypto chart tools and TradingView invite scripts for equities/forex.
How it is calculated
Computes the cumulative ratio of typical price multiplied by volume over cumulative volume since session start. Calculates variance from this benchmark to project dynamic Gaussian standard deviation envelopes.
Calculation Inputs & Parameters
- Anchor period (Session, Daily, Weekly, or Monthly)
- Standard deviation multipliers (Default: 1.0, 2.0, 3.0 sigma)
- Price source (Typical: (High + Low + Close) / 3)
Signal Trigger Conditions
- Mean-reversion short setup triggers when price touches or exceeds the +2.5σ or +3σ band and prints a rejection candle.
- Mean-reversion long setup triggers when price touches or dips beneath the -2.5σ or -3σ band and prints a rejection candle.
How to read it
Understanding the visual elements rendered on the chart:
Session Volume-Weighted Average Price. Acts as the institutional equilibrium baseline.
Statistically overextended upward territory where aggressive buying is historically stretched relative to volume.
Statistically oversold downward territory where aggressive selling is historically stretched relative to volume.
Limitations and edge cases
During runaway trend days (news breakouts, short squeezes), price can hug the outer +3σ band all day without reverting to mean.
Unsuited Market Conditions
- Strong momentum trend days where trading counter-trend into deviation bands leads to repeated stop-outs.
- Low-volume periods near the end of session where VWAP sensitivity flattens.
What this indicator does not do
- Does not prevent trending momentum from continuing beyond the 3-sigma band.
- Does not function accurately across disconnected illiquid spot tickers.