
Exhaustion Finder Indicator
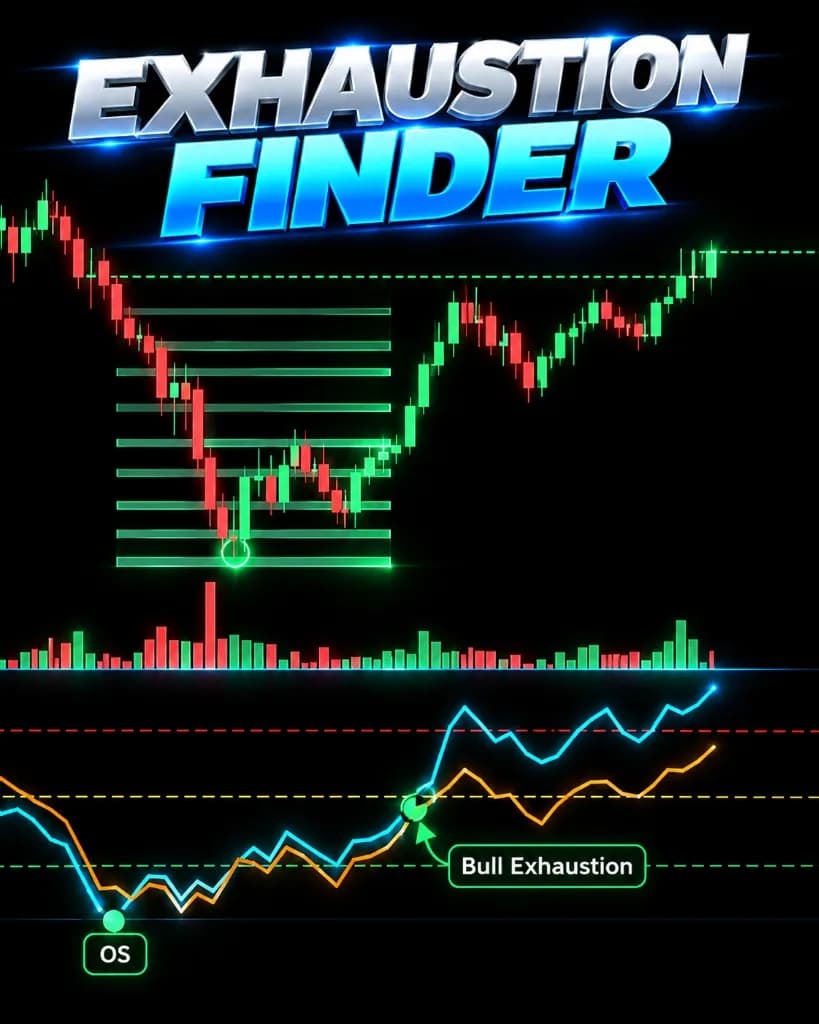
The Exhaustion Finder Indicator tracks multi-layer momentum decay and statistical volume exhaustion, plotting early reversal markers when price reaches overbought or oversold extremes as trading volume contracts.
Available in the Pro tier. Includes native crypto chart tools and TradingView invite scripts for equities/forex.
How it is calculated
Combines smoothed dual-oscillator momentum tracking with rate-of-volume deceleration. When price pushes into extremity boundaries while oscillator rate-of-change and volume contract, an exhaustion beacon is triggered.
Calculation Inputs & Parameters
- Fast momentum cycle period (Default: 9 bars)
- Slow momentum cycle period (Default: 21 bars)
- Overbought / oversold thresholds (Default: +80 / -80)
Signal Trigger Conditions
- Top Exhaustion: Price hits a higher high while momentum prints lower highs above +80 accompanied by volume drop.
- Bottom Exhaustion: Price hits a lower low while momentum prints higher lows below -80 accompanied by volume drop.
How to read it
Understanding the visual elements rendered on the chart:
Selling exhaustion warning; buying pressure is drying up at resistance.
Buying exhaustion warning; selling pressure is drying up at support.
Extreme threshold indicating extended momentum conditions.
Limitations and edge cases
Exhaustion signals can remain in overbought or oversold territory for extended periods during strong parabolic trend runs.
Unsuited Market Conditions
- Parabolic trend expansions driven by unexpected news catalysts.
- Range-bound chop with very low amplitude where signals trigger prematurely.
What this indicator does not do
- Does not trigger immediate market execution without price structural confirmation.
- Does not predict the exact top or bottom candle wick.