
Volume Imbalance Indicator
The Volume Imbalance Indicator highlights candlesticks where aggressive market buying or selling orders heavily exceed normal distribution, pinpointing institutional absorption and breakout pressure on live charts.
Available in the Pro tier. Includes native crypto chart tools and TradingView invite scripts for equities/forex.
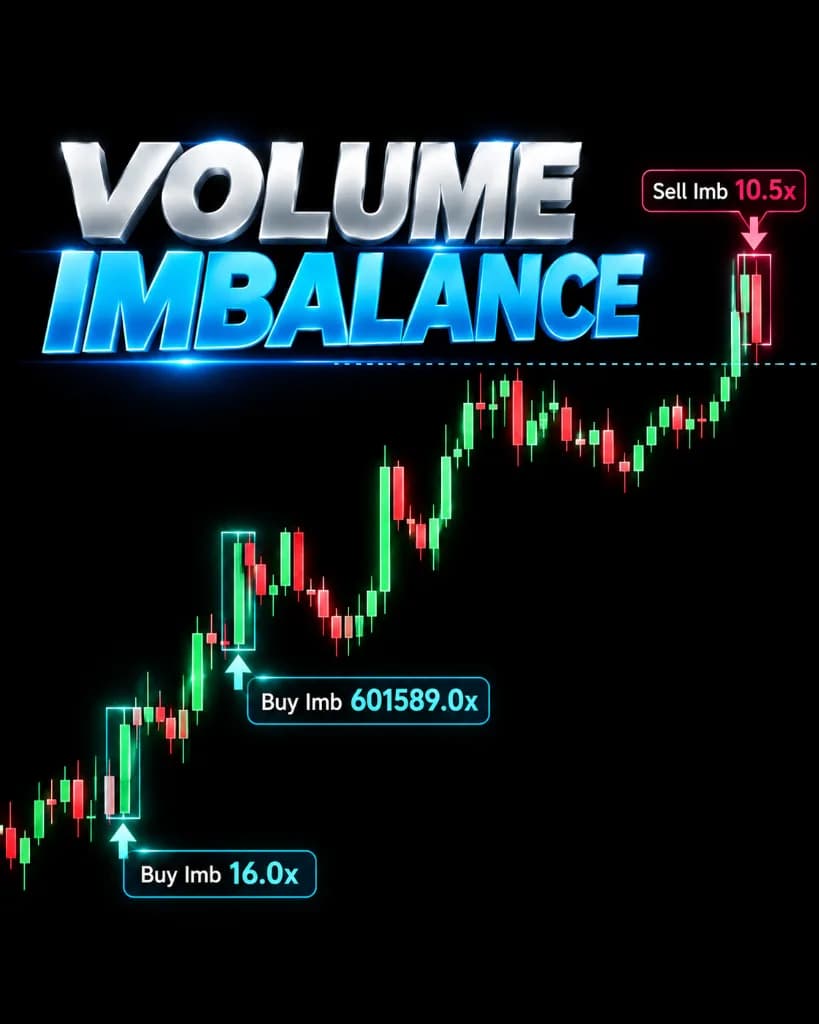
How it is calculated
Computes estimated intra-bar buyer versus seller delta by evaluating upper and lower wick rejections against body displacement, multiplying directional scores by total candle volume, and comparing against a rolling 20-period volume SMA.
Calculation Inputs & Parameters
- Volume moving average period (Default: 20 bars)
- Imbalance ratio multiplier threshold (Default: 2.5x)
- Intra-bar displacement weighting factor
Signal Trigger Conditions
- Total candle volume must exceed the 20-period rolling volume SMA.
- Directional buy delta must exceed sell delta by the ratio threshold for a Buy Imbalance (or vice-versa for Sell Imbalance).
How to read it
Understanding the visual elements rendered on the chart:
Indicates aggressive buyer dominance on high volume, signifying aggressive buying through limit ask orders.
Indicates aggressive seller dominance on high volume, signifying aggressive selling through limit bid orders.
Displays the relative ratio of dominant volume versus opposing volume on that specific bar.
Limitations and edge cases
Volume imbalances indicate aggressive execution but do not guarantee continuation if large resting limit orders absorb the move immediately after.
Unsuited Market Conditions
- Exchanges with zero-fee trading where wash trading distorts volume figures.
- Low-volume pre-market sessions where single retail market orders trigger false imbalance ratios.
What this indicator does not do
- Does not reveal hidden iceberg orders on central limit order books.
- Does not account for off-exchange dark pool transactions.