
Dynamic Order Blocks Indicator
The Dynamic Order Blocks Indicator detects institutional supply and demand zones across multiple timeframes, calculating target mitigation levels and invalidation markers directly on the live chart.
Available in the Ultra Pro tier. Includes full suite access to native charting engine and complete SMC algorithms.
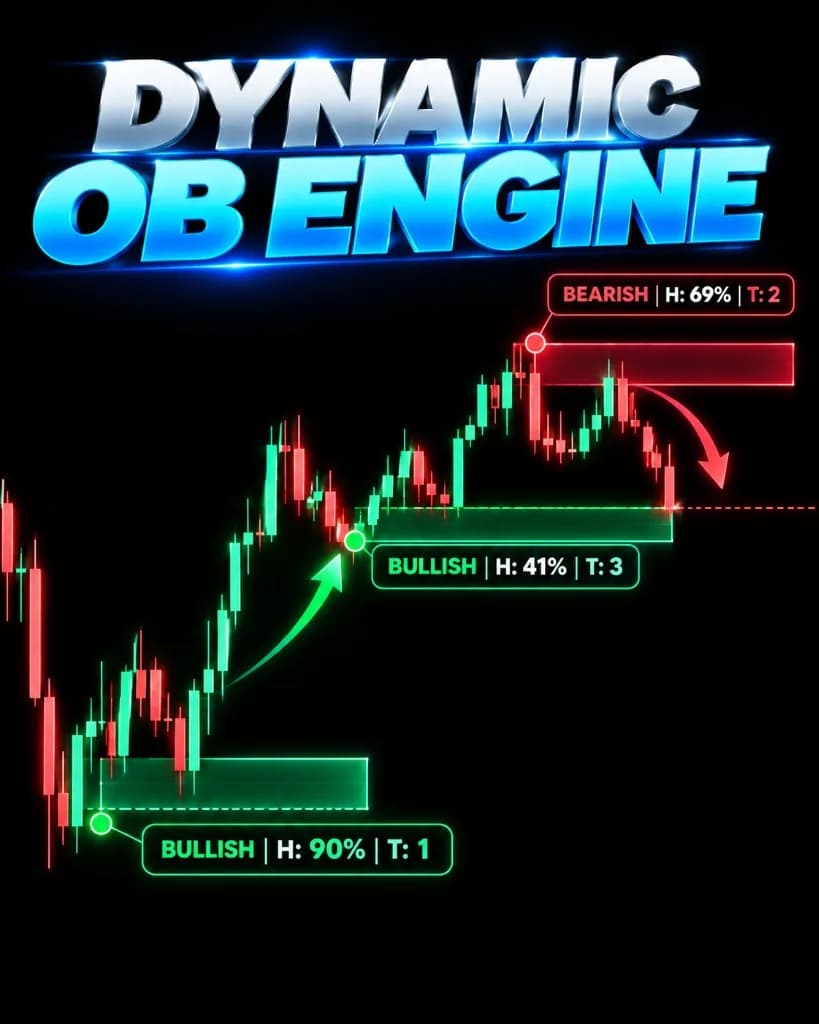
How it is calculated
Tracks the origin of aggressive volume displacement candles, catalogs the zone across higher and local timeframes, and projects sequential Fibonacci-derived target lines until price fully mitigates the zone.
Calculation Inputs & Parameters
- Displacement threshold ratio (Default: 2.0x)
- Target extension ratios (Default: 1.0, 1.618, 2.618)
- Mitigation tracking mode
Signal Trigger Conditions
- Zone creation triggers when an impulsive candle sequence creates an unmitigated structural imbalance.
- Target levels (T1, T2, T3) are dynamically plotted upon confirmed retest bounce.
How to read it
Understanding the visual elements rendered on the chart:
Active accumulation order block. Watch for bullish reaction upon first mitigation.
Active distribution order block. Watch for bearish reaction upon first mitigation.
Structural extension target levels projected from the order block mitigation reaction.
Limitations and edge cases
Zones that have been mitigated multiple times lose statistical validity as resting orders are absorbed.
Unsuited Market Conditions
- High-volatility news spikes where price slices cleanly through multiple zones without pausing.
- Expired sessions where liquidity has shifted to higher timeframe levels.
What this indicator does not do
- Does not guarantee that price will stop at the marked zone boundaries.
- Does not eliminate the necessity of hard stop-loss risk management.